
Country Stories
With an average per capita GDP of about US$ 43,146, Europe & North America is the wealthiest of the five regions and home to a total population of about 1.1 billion. In 2026, 49% of the 41 countries covered in the CGGI improved their scores, and the region remains the best performer since 2021. Europe & North America had 14 countries ranked in the global top 20 in 2026. It also accounted for about half of the 28 countries globally with either lower or unchanged overall CGGI scores in 2026. The average overall CGGI scores for countries in sub‑regions of Eastern Europe and Southern Europe trail those for Northern Europe, Western Europe, and North America.
Europe & North America
Average Pillar Ranks in 2026
Europe & North America
Average Pillar Scores (Year‑on‑Year Change 2021–2026)
The World’s Governance Benchmark
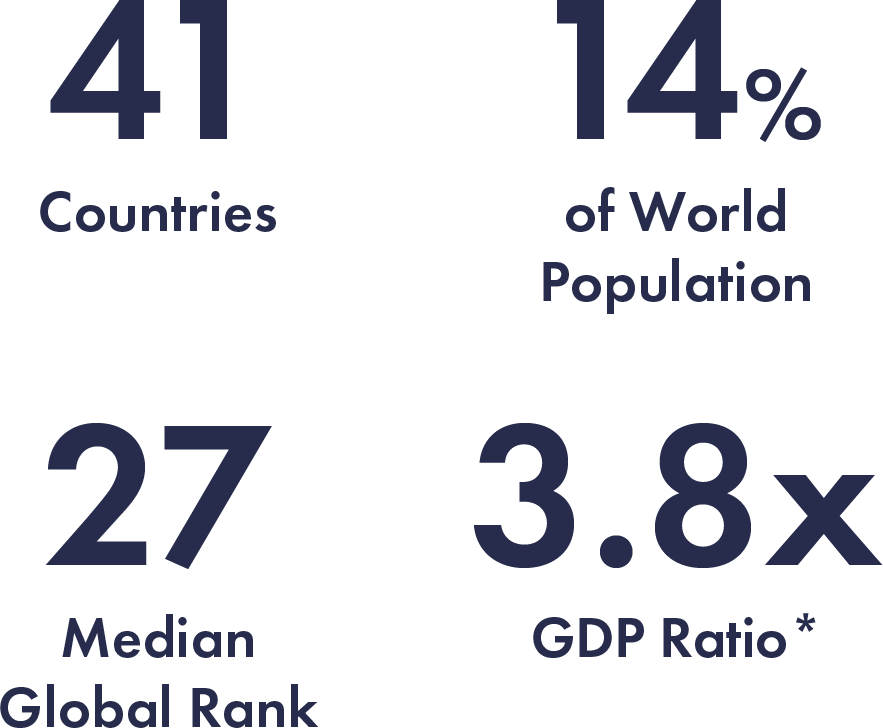
Europe & North America remains the best‑performing region in the Index for the sixth consecutive year. The region’s 41 countries included in the CGGI account for roughly one‑sixth of the world’s population,1,2 but make up a disproportionately large share of global GDP3 and military spending.4 The U.S. alone accounts for over a quarter of the world’s nominal GDP and more than a third of annual global military expenditure.
Three Defining Pressures Shaping the Region
Three structural forces dominate the policy landscape. The first is demographic. Europe’s working‑age populations are projected to decline in 22 of the 27 European Union (EU) member states by 2050, with the EU expected to lose around one million workers per year in the decades ahead.5,6,7 Eastern and Southern Europe face the steepest declines. This puts mounting pressure on pension systems, healthcare, and long‑term care at a time when governments are being asked to invest more in digital infrastructure, energy transition, industrial competitiveness, and defence.8 That places a premium on governments finding ways to invest across competing long‑term commitments.

The second force is geopolitical. The Russia–Ukraine war (both countries are included in the Index) continues to influence refugee flows, energy disruption, and defence spending pressures across Europe. The EU defence expenditure is projected to rise by 0.5% of GDP between 2024 and 20279—roughly an additional EUR 100 billion a year in today’s prices—adding to deficit pressure at a time when several major European economies have public debt ratios above 100% of GDP10 (in the U.S., federal debt has surpassed 120% of GDP).11
Geopolitics is also reshaping the region’s trade. A transatlantic partnership remains important to both the U.S. and the EU—the two remain each other’s largest trading and investment partners12—yet recent years have seen renewed debate over industrial subsidies, supply‑chain security, and the role of tariffs in key sectors. Periodic trade tensions across steel, technology, and clean energy have introduced additional uncertainty.
The third force, intertwined with the first two, is technology and productivity. Between 2008 and 2023, nominal U.S. GDP grew by more than 80%; the EU’s by around 14%.13 That divergence has sharpened debate across Europe about long‑term competitiveness and innovation. Policymakers have increasingly focused on scaling investment in artificial intelligence, advanced manufacturing, and clean technologies, while also exploring deeper capital markets integration to mobilise private investment.14 In the U.S., trade and industrial policy tools,
including tariffs, have taken on greater strategic significance in shaping domestic and international economic priorities.
A Region with Mixed Trajectories
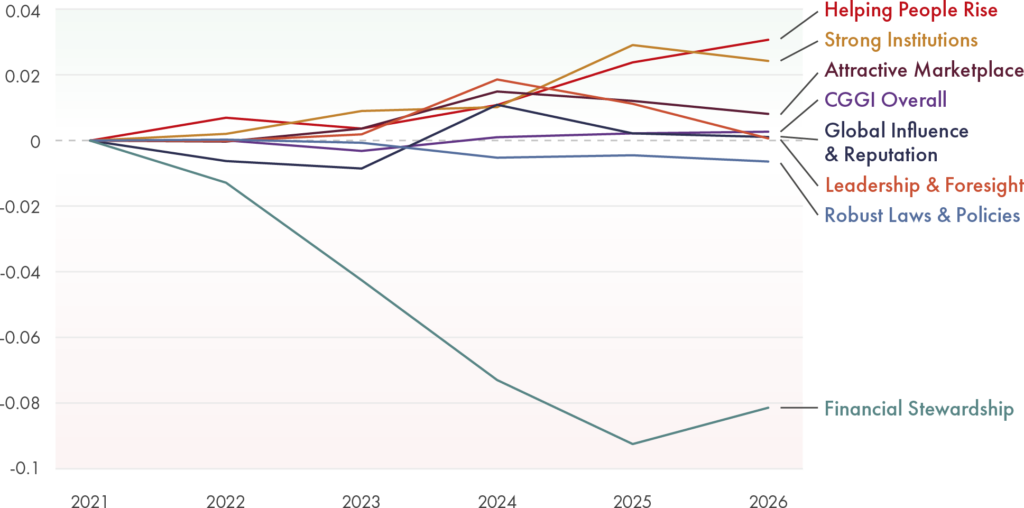
Set against those pressures, the Index results paint a mixed picture. About half of the countries in the region improved their overall CGGI scores between 2021 and 2026, while 49% improved between 2025 and 2026.
That picture varies by pillar. Financial Stewardship saw the largest average score decline across the region of any pillar since 2021. Only eight countries improved their Financial Stewardship score over that period, with Portugal posting the largest gain. This is consistent with an environment of rising public debt, higher interest bills, and constrained fiscal space across both Europe and North America.

The Helping People Rise pillar runs in the opposite direction. The region posted the largest average score improvement compared with 2021, with Spain recording the biggest gain. The combination suggests a region under fiscal strain that has nonetheless maintained, and in many cases improved, the quality of outcomes delivered to citizens.
Diverging Paths Among Sub‑Regions
Europe & North America comprises five sub‑regions, none of which outperform Northern Europe. Six of the countries ranked in the global top 10 sit in this sub‑region, and even its lowest‑ranked member, Latvia, placed 33rd overall.
The region’s lowest‑scoring countries are concentrated in Southern and Eastern Europe: the 15 lowest‑ranked countries in Europe & North America all come from one of those two sub‑regions. Two caveats are important. First, these are lower‑performing countries within a high‑performing region. Bulgaria, for example, ranked 11th from the bottom in Europe & North America but is still placed within the top 50 countries globally.
Second, momentum is present. Bosnia and Herzegovina, North Macedonia, and Montenegro—three of the lowest‑scoring countries in Southern and Eastern Europe—all improved their overall CGGI scores between 2025 and 2026 and increased their scores in the Helping People Rise pillar.
Some of the region’s strongest success stories also emerged from Southern Europe. Italy recorded the most improved overall score in Europe & North America between 2021 and 2026, followed by Greece, which posted the region’s best score improvement in the Attractive Marketplace pillar.
Such results suggest that meaningful governance improvements are occurring across a wider range of countries than headline rankings alone might imply.

Norway
Norway climbed two places this year to rank second overall in the CGGI. Since 2021, it has improved its scores in six of the seven pillars, with the biggest gains coming in Attractive Marketplace, Financial Stewardship, and Helping People Rise. Norway’s fiscal position is anchored by a long‑standing rule limiting annual spending from its sovereign wealth fund—the Government Pension Fund Global, now valued at around US$ 1.7 trillion—to 3% of the fund’s value.15 Low corporate tax rates and a renewable energy base have drawn sustained foreign investment.16

Germany
Germany has topped the Global Influence & Reputation pillar for six consecutive years. Every indicator within that pillar ranks in the global top five, with the strongest growth over the period coming in International Diplomacy. The country also ranks in the top ten for the Strong Institutions pillar. Those results run alongside a significant reorientation of German foreign policy. In 2022, Germany committed to higher defence spending and a stronger posture within NATO and the EU, a shift publicly framed as a Zeitenwende, or “turning point”.17 German leaders have also used the G7, EU, and UN platforms to advance positions on climate finance, development, and global health, translating economic weight into sustained diplomatic engagement.18

Finland
Finland’s overall CGGI score declined slightly between 2021 and 2026, including in its world‑leading Robust Laws & Policies pillar. Within that pillar, it ranked second globally in the Rule of Law, and first in Quality of Bureaucracy and Quality of Judiciary indicator under the Strong Institutions pillar. Finland’s rule‑of‑law standing has been reinforced through sustained institutional attention. A National Anti‑Corruption Strategy running from 2020 to 2023 strengthened prevention through a civil service code of conduct, whistleblower protections, and sector‑specific monitoring. A successor programme through 2026 has extended those efforts into training and monitoring tools.19,20 Successive governments have also prioritised broader stakeholder engagement in the legislative process and the routine evaluation of policies once in effect.21

Greece
Greece has had the second‑best overall score improvement in Europe & North America since 2021, leading the region in gains in the Attractive Marketplace pillar. That trajectory runs alongside a period of economic stabilisation. Greece’s public debt briefly exceeded 200% of GDP during the pandemic, but the country has since exited its bailout programmes, returned to primary budget surpluses, and recovered investment‑grade credit ratings from all major agencies.22 A broad digital transformation of public services—bringing more than 2,100 government services onto a single platform—has reduced administrative friction for citizens and businesses alike.23,24

Czech Republic
The Czech Republic improved its overall CGGI score for the second consecutive year in 2026. Between 2021 and 2026, it posted notable improvements in Global Influence & Reputation, Helping People Rise, and Robust Laws & Policies pillars. Those results coincide with the country actively diversifying trade relationships, pursuing new agreements, and hosting targeted trade missions.25 A nation‑branding initiative—“Made in Czechia”26— sought to build recognition for Czech manufacturing quality in new markets, including Asia and Africa.
Endnotes